Start Analyzing your Projects with SonarQube
Introduction
SonarQube is an open source quality management platform, designed to analyze and measure your code’s technical quality. It is used to test code written in the main programming languages such as C/C++, JavaScript, Java, C#, PHP, and Python, and even a combination of several languages simultaneously.
SonarQube not only provides a complete report of code bugs, syntax errors, and vulnerabilities, but also suggestions and examples about how to fix your code. It also measures the technical debt, so you can easily calculate the time you will spend fixing these issues.
In this guide, you will learn how to run a code analysis using a sample project, use the SonarQube user interface (UI) to obtain all details about the issues and run new analysis when the issues have been solved. To take a step further in the use of SonarQube, this tutorial will walk you through the process of integrating your GitHub repositories and Travis builds with SonarQube, so you can focus on writing more and better code.
Assumptions and prerequisites
This guide makes the following assumptions:
- You are using the Bitnami SonarQube Stack.
- You have a GitHub account.
- You have a Travis account.
Step 1: Create a project in SonarQube
-
The first step is to log in to SonarQube to create a new project and then to start analyzing your code. This tutorial provides you with a sample of code that you can use to follow the instructions below. You can try SonarQube using your own application code; just skip those steps that apply to the Bitnami sample project.
-
To create a project in SonarQube:
-
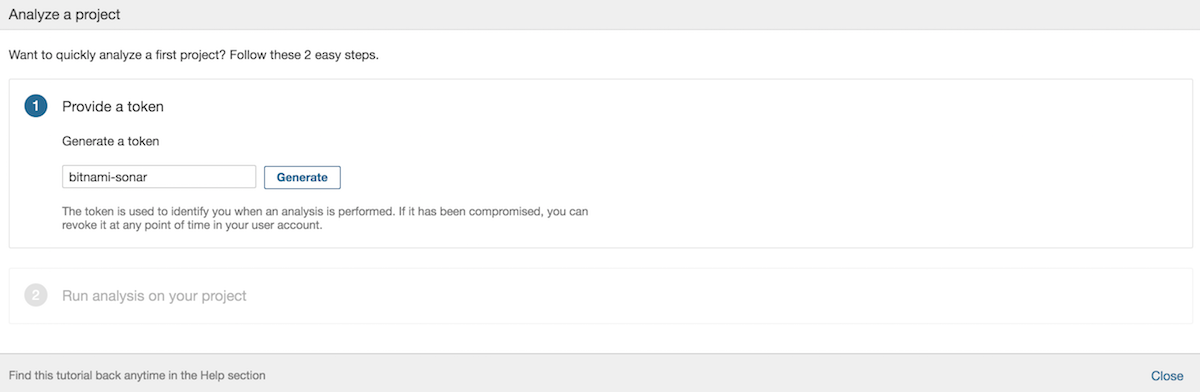
Generate an authentication token. Save the resulting token in a safe place. You will need it later to connect your project to SonarQube.
-
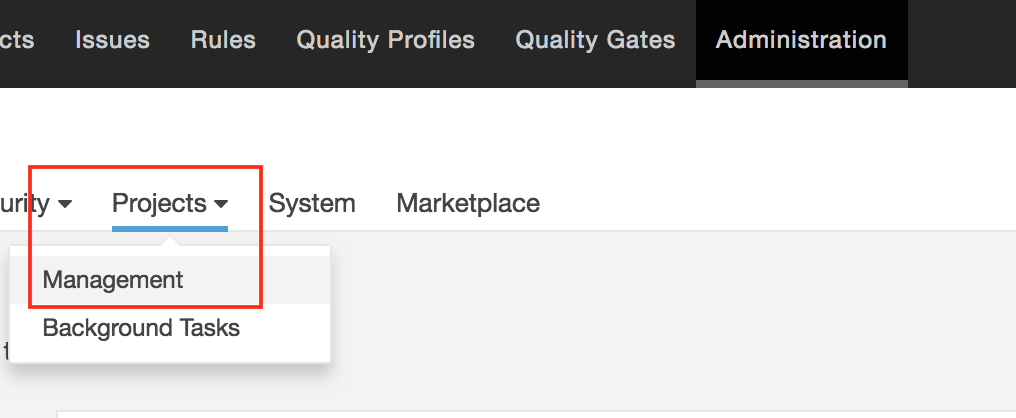
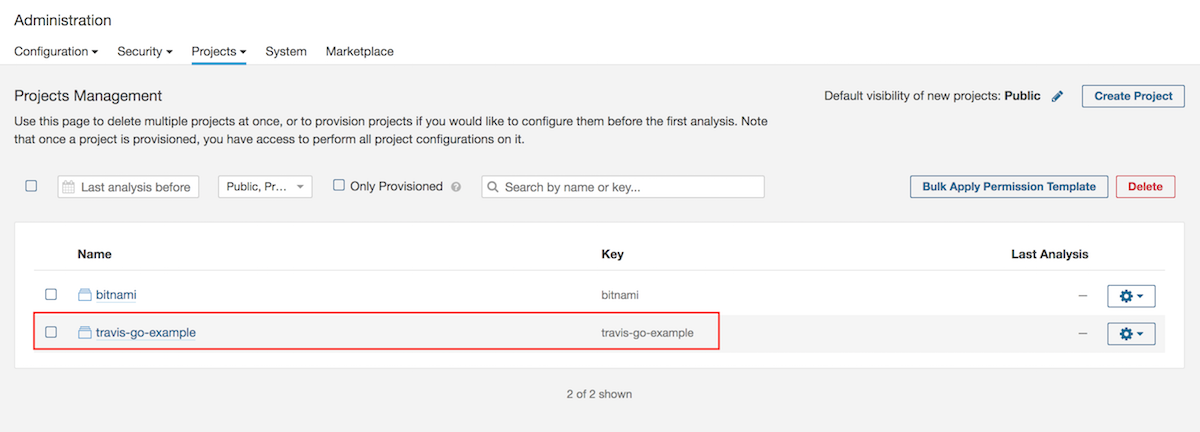
Navigate to the “Administration -> Projects -> Management” section.
-
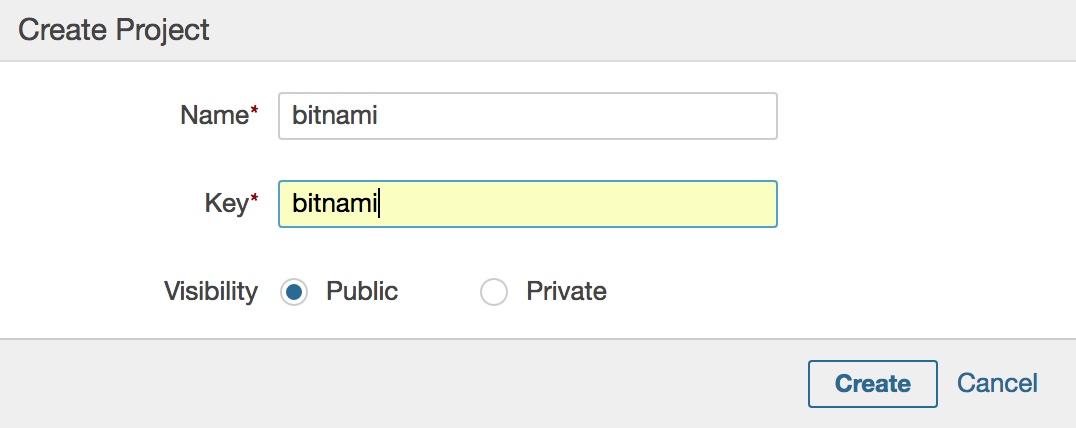
In the “Projects Management” screen, click “Create Project”.
-
Enter a name for your project and a key. Select the visibility of the project. Click “Create” to finish the process.
Step 2: Install and configure the sonarqube-scanner client
The next step consists of configuring SonarQube to start analyzing projects. To do so, you need to have git and the sonarqube-scanner client installed and configured, as well as a code repository to scan on hand.
-
Log in to the server console. Learn how to connect to the server through SSH.
| TIP: The instructions below are specific for Linux OS distributions. Follow the SonarQube official documentation to learn how to install and configure the sonar-scanner client on Windows or macOS.
-
Install git. Execute the install command as root:
sudo su apt-get install git -
Clone the sample code repository. (Skip this step if you are using your own code to test SonarQube).
git clone https://github.com/bitnami/sample-mean.git -
Download and install the latest version of the sonarqube-scanner client. Remember to replace the X.Y.Z placeholder with the corresponding version.
wget https://sonarsource.bintray.com/Distribution/sonar-scanner-cli/sonar-scanner-cli-X.Y.Z-linux.zip unzip sonar-scanner-cli-X.Y.Z-linux.zip -
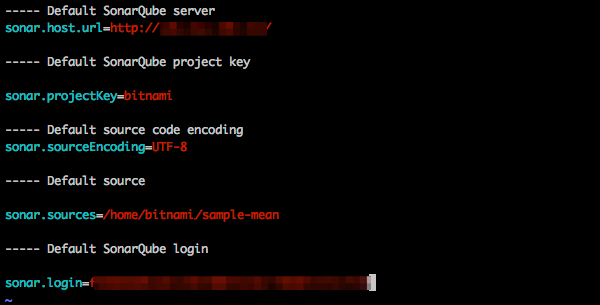
Edit the sonar-scanner-X.Y.Z-linux/conf/sonar-scanner.properties file in order to configure project analysis. Enter the following parameters:
- sonar.host.url: IP address of your SonarQube server instance.
- sonar.projectKey: key name you gave when you created the project.
- sonar.sources: path to the project to analyze.
- sonar.login: SonarQube authentication token.
Learn more about SonarQube Analysis Parameters in the official SonarQube documentation. Now the sonarqube-scanner is configured and ready to run the first project analysis.
Step 3: Analyze the code with SonarQube and fix issues and bugs
Let’s see how SonarQube works by running a project test using the example provided. To do so:
-
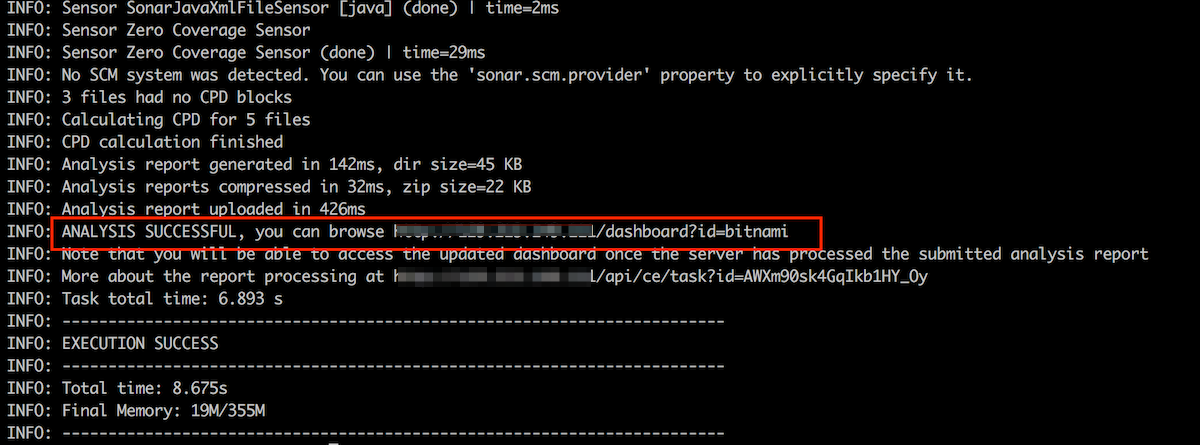
Run the sonar-scanner command to start the analysis.
sonar-scanner-X.Y.Z-linux/bin/sonar-scannerOnce it finishes, you will see in the log’s information that the analysis was successfully executed. Find there the URL where the analysis results are published.
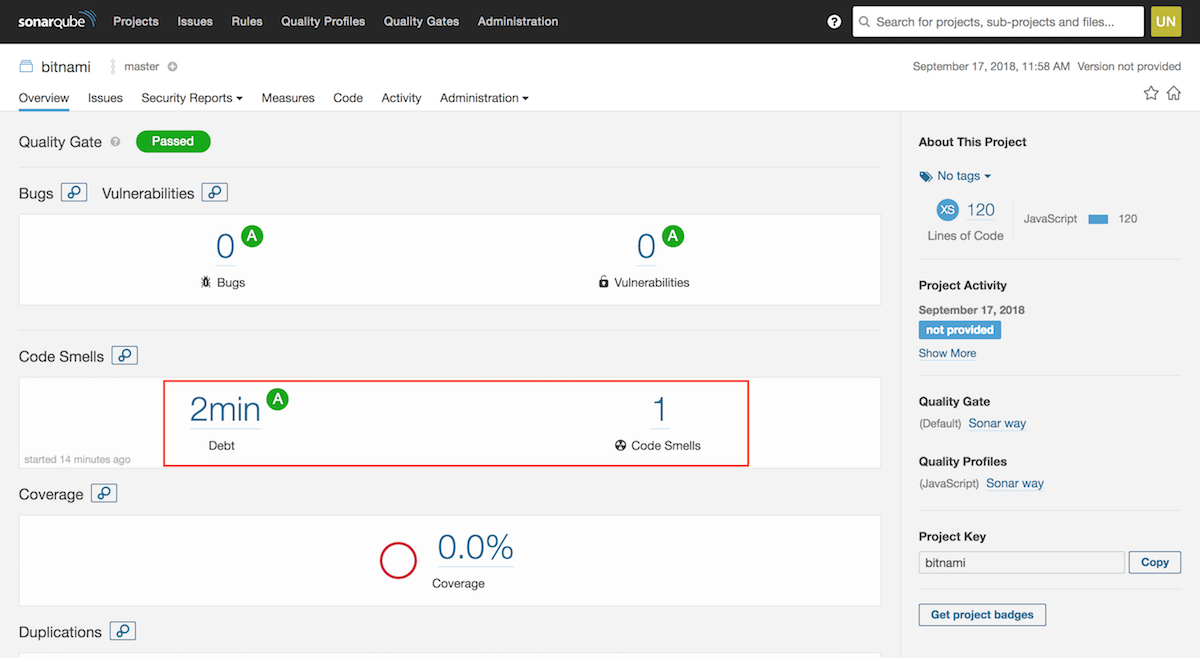
To see the results of the analysis, navigate to the SonarQube UI or enter the above mentioned URL in your browser. The “Overview” dashboard displays the following information:
- Bugs and vulnerabilities.
- Code smells and the time you will spend fixing these errors.
- The average of your code that has been covered running the test.
- Percentage of duplications and the number of duplicated blocks were found in your code.
As seen in the image below, our sample code has one code smell that will take us two minutes to solve.
-
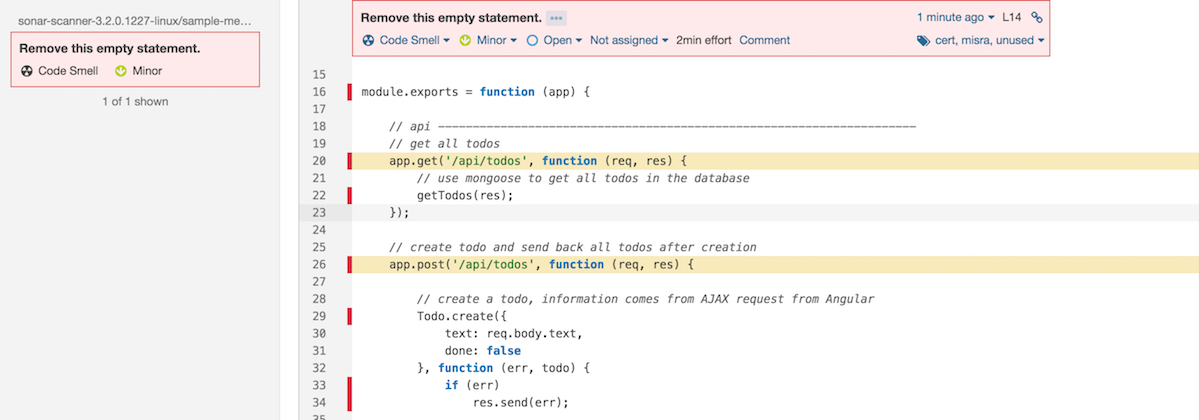
Navigate to the “Issues” section to check this code smell in detail. In the resulting screen, you will find which file is the affected. Click on the warning message to see the proposed solution.
Try the following test to detect new errors in the code and how to solve them.
-
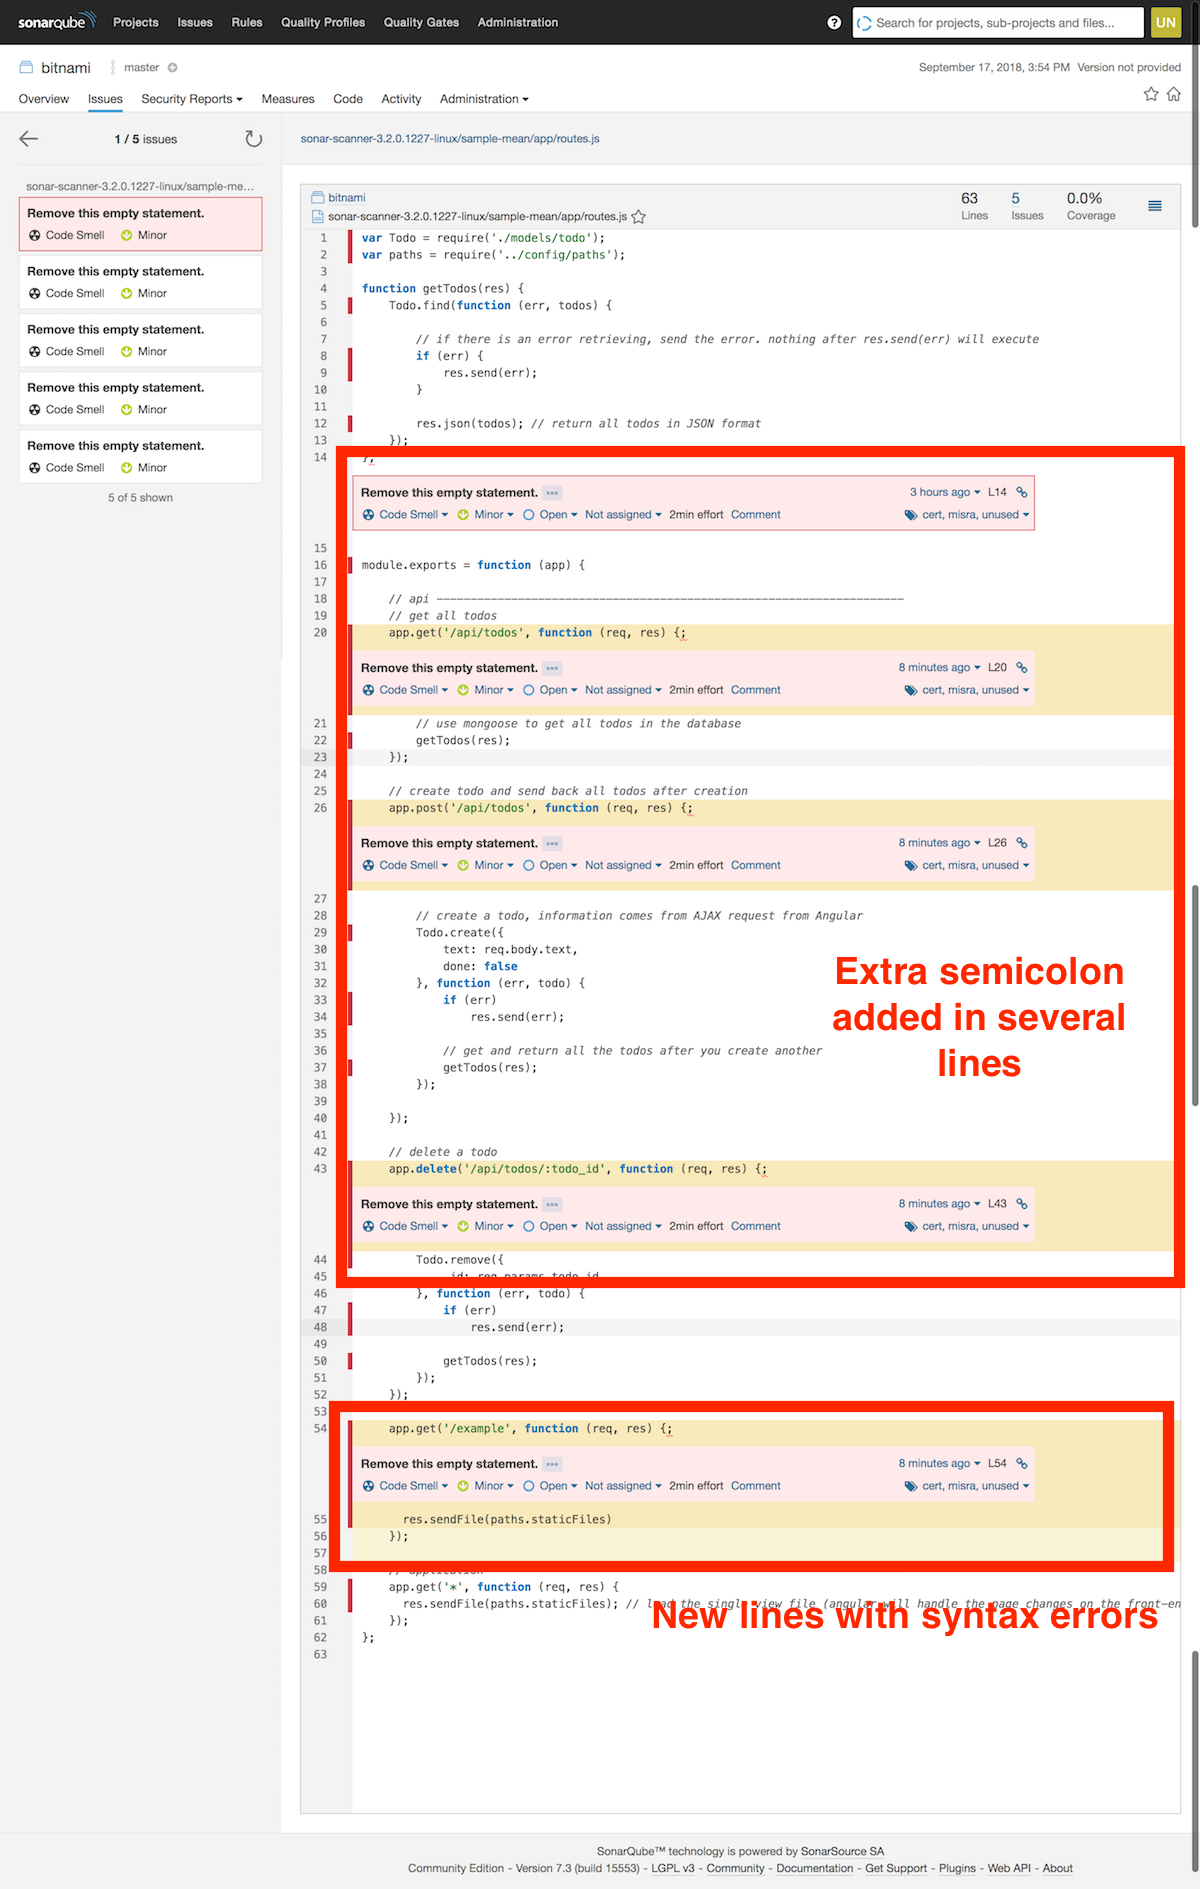
Open the app/routes.js file and introduce new errors in the code as shown below:

-
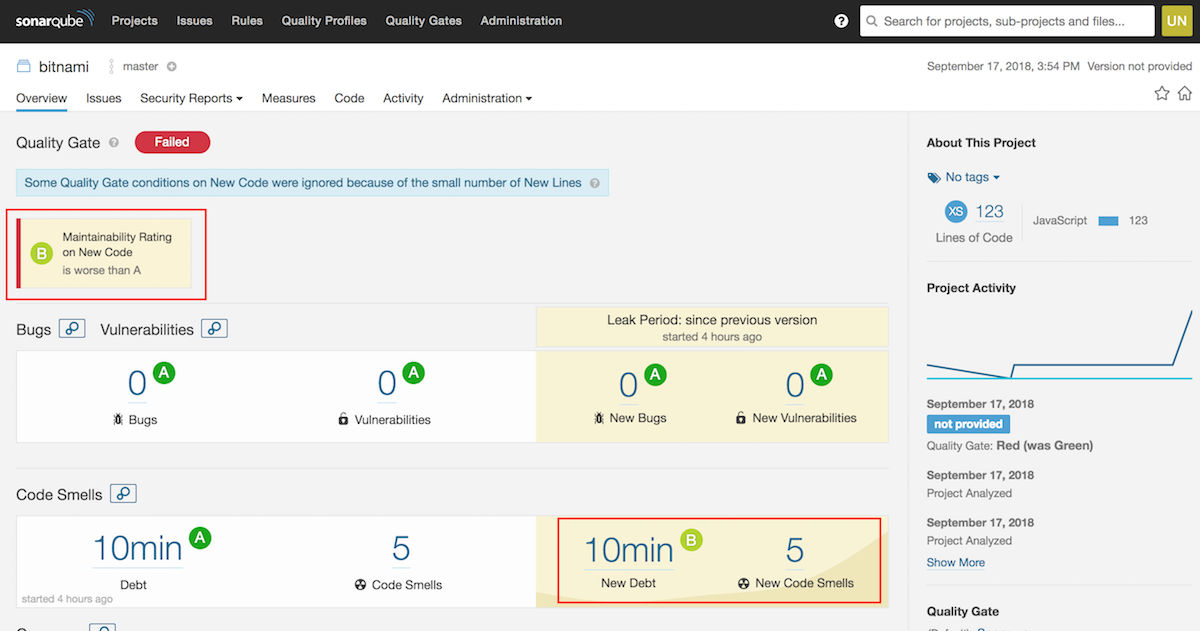
Execute the sonar-scanner command again. As expected, new code smells appear and the time for solving these issues has increased.
A new section appears on the right-hand side of the screen (highlighted in yellow). SonarQube handles two states: the current state (in white) and the latest changes. As seen in the screenshot, the changes introduced in the last scan have added four new code smells. SonarQube evaluates the quality of each section with a score based on different parameters,with “A” being the best state. It also indicates the quality, if the new code is worse than the previous version, and that new five lines have been added:
-
Navigate to the “Issues” section to see those new errors in detail:
-
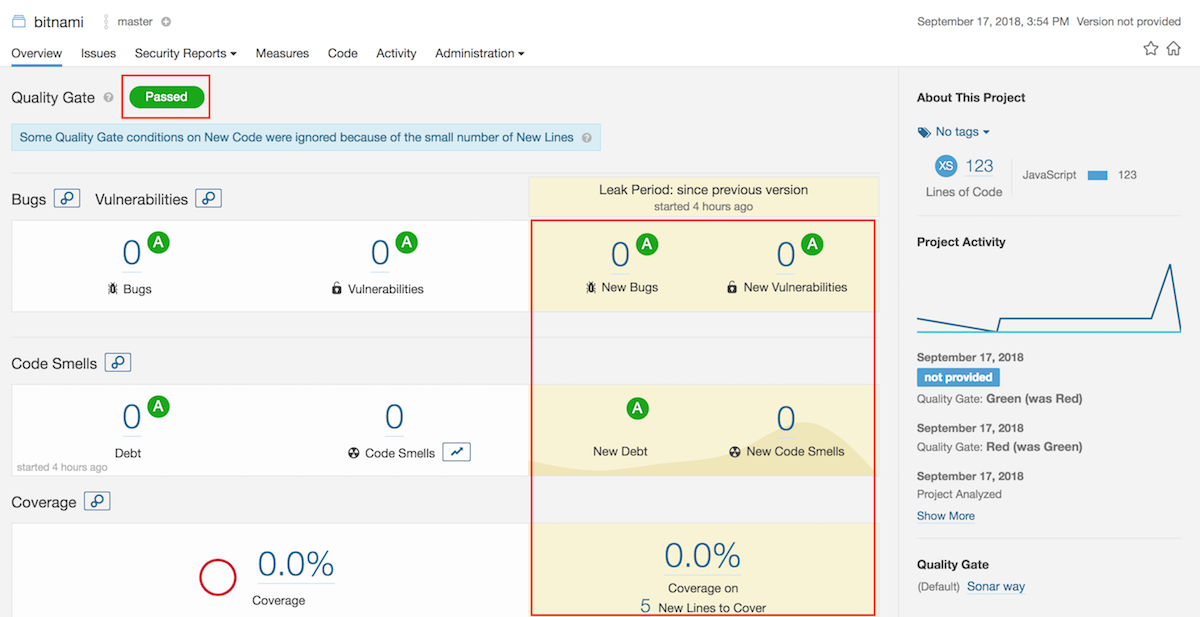
Fix all code errors. To check the project again, run a new analysis. Congratulations! Your code has passed the test and no new code smells were detected:
Step 4: Integrate SonarQube and GitHub with Travis
To take a step further in the use of SonarQube, we are going to integrate Travis with SonarQube. Travis provides an example repository that helps you get started analyzing projects with SonarQube. Follow the instructions below:
-
Create a new project in SonarQube following the instructions you can find in step 1.
-
Sign in to GitHub and navigate to the Travis sample project. Fork the repository.
-
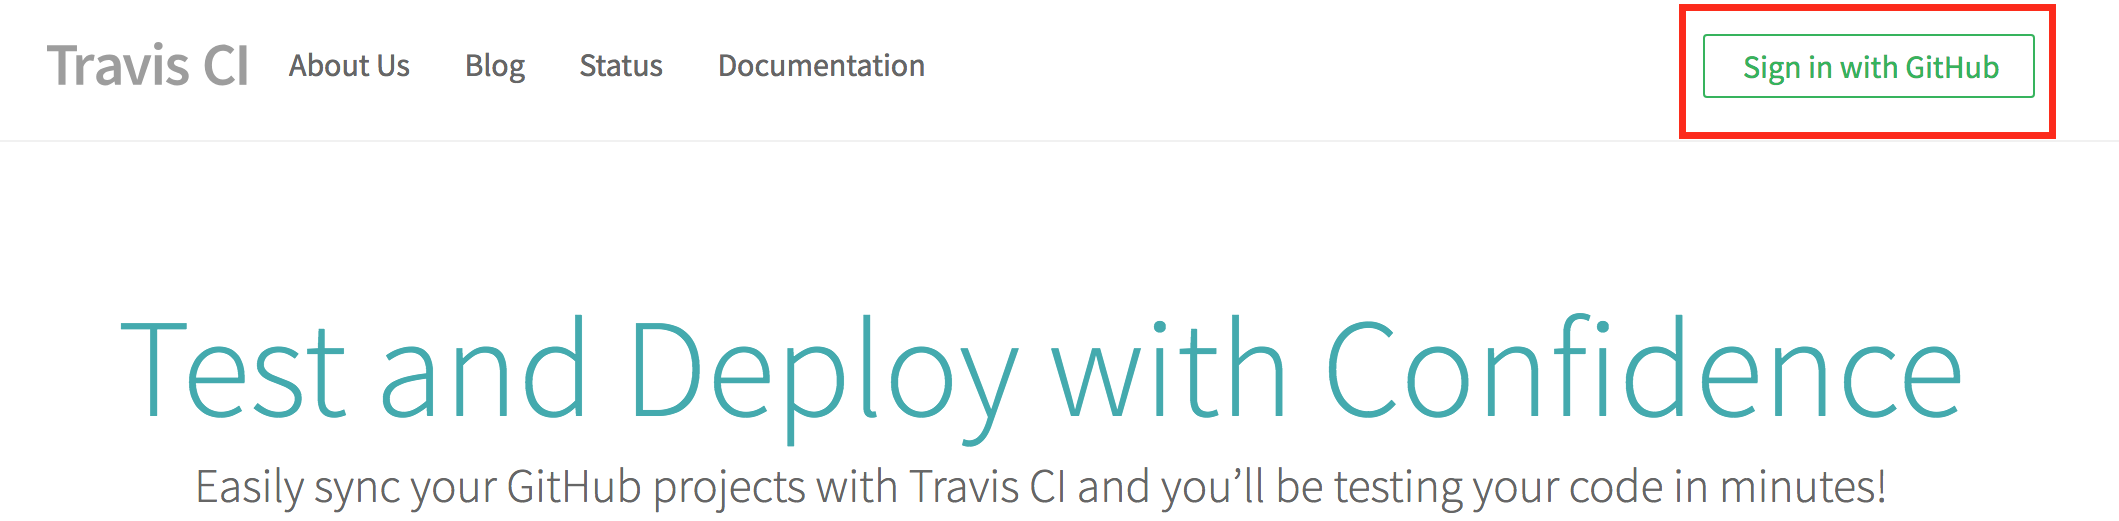
Sign in Travis using your GitHub account. That way, both will be synchronized.
-
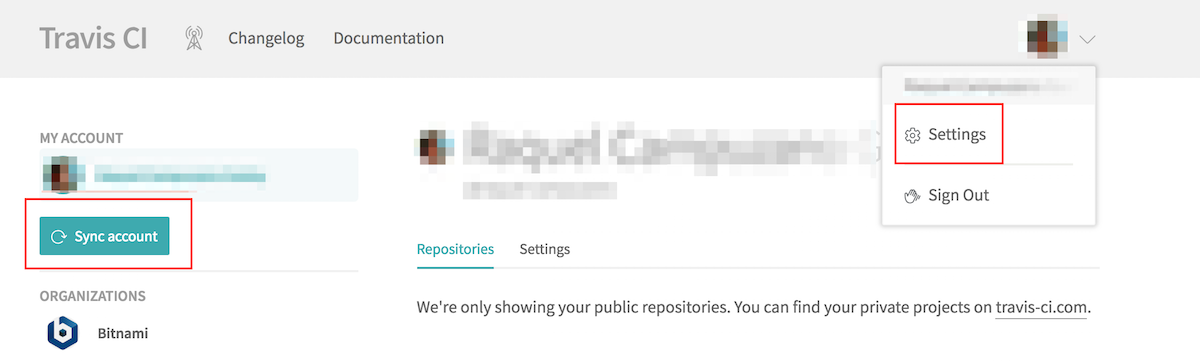
In the user profile options, select “Settings”. In the resulting screen, click “Sync account” to update your repositories list.
-
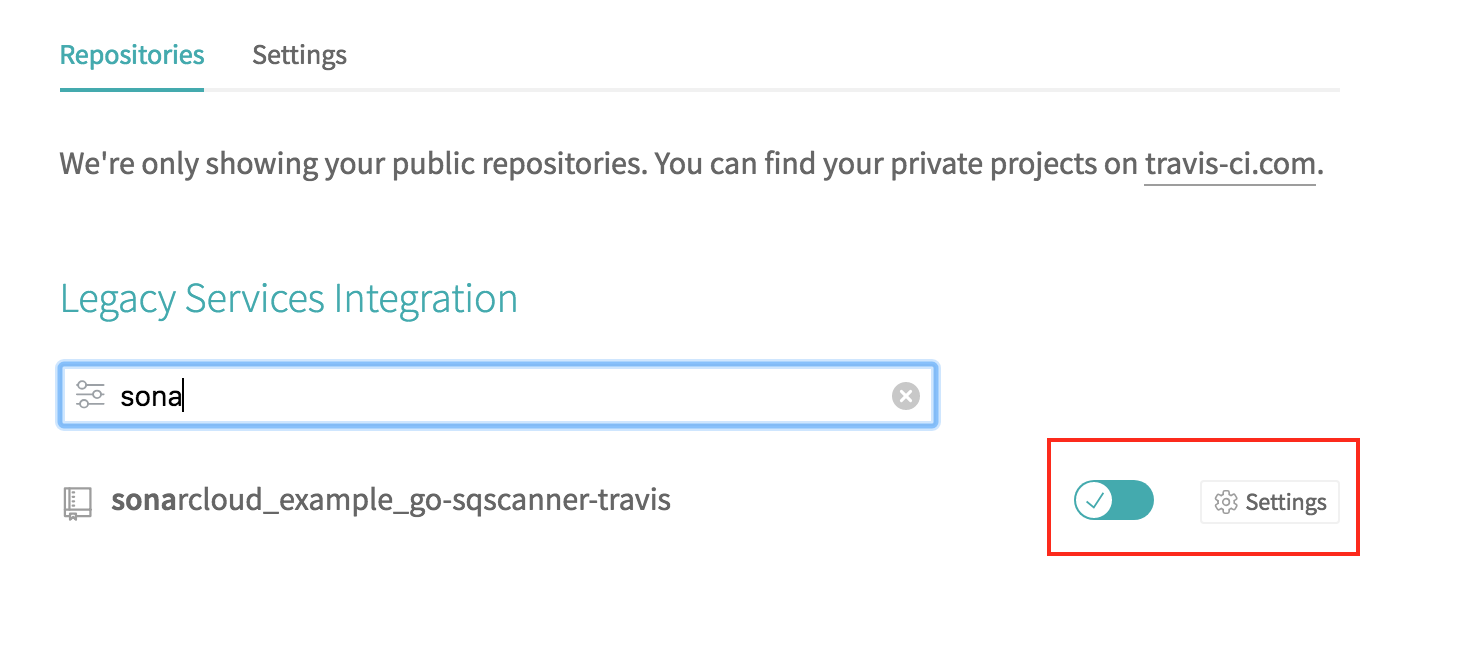
Search for the sonarcloud_example_go-sqscanner-travis repository, activate the repository, and then, click “Settings”.
-
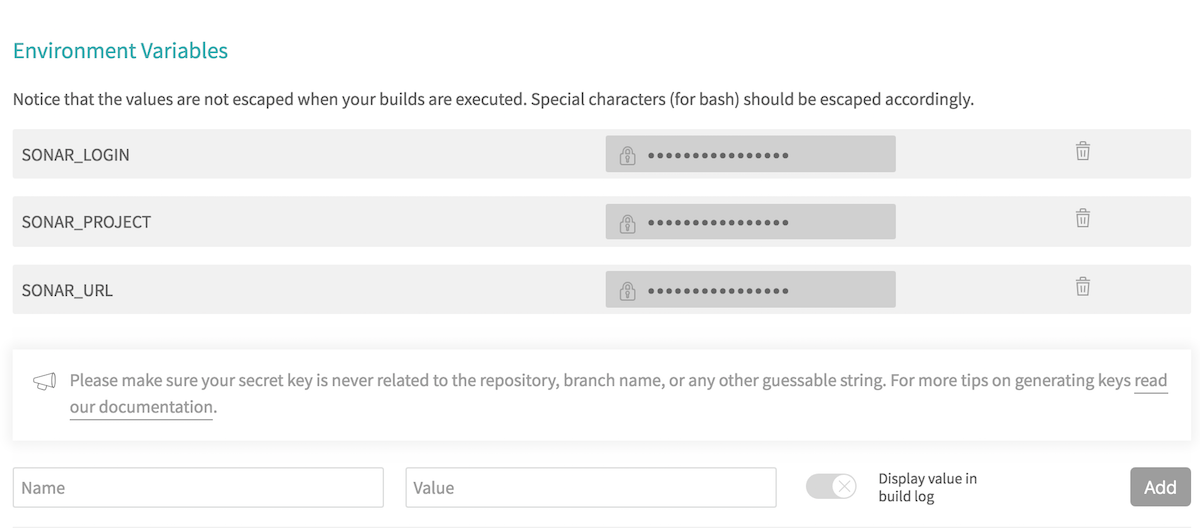
Enter the following parameters in the “Environment Variables” section:
- SONAR_LOGIN: SonarQube token.
- SONAR_URL: URL of your SonarQube server instance.
- SONAR_PROJECT: Key you gave when creating the project in SonarQube.
-
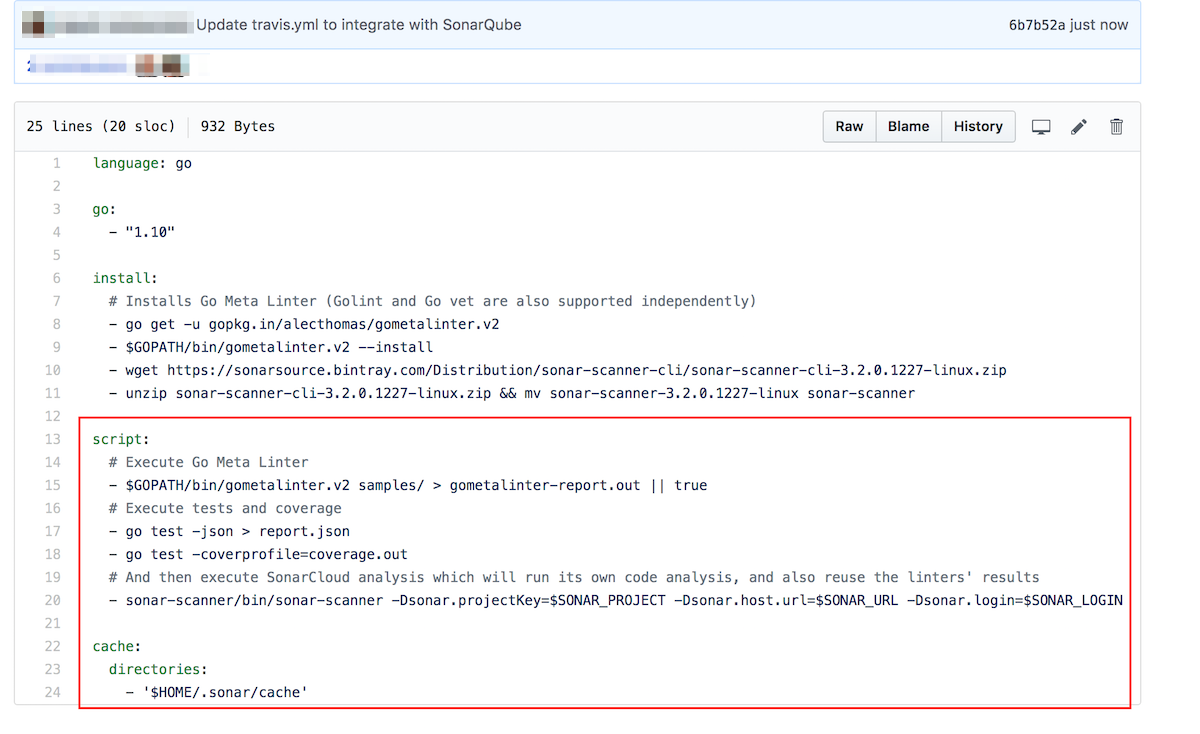
In your GitHub account, browse to the forked Travis sample project, edit the travis.yml file, and add the following content:
  language: go

  go:
    - "1.10"

  install:
    #Installs Go Meta Linter (Golint and Go vet are also supported independently)
    - go get -u gopkg.in/alecthomas/gometalinter.v2
    - $GOPATH/bin/gometalinter.v2 --install
    - wget https://sonarsource.bintray.com/Distribution/sonar-scanner-cli/sonar-scanner-cli-3.2.0.1227-linux.zip
    - unzip sonar-scanner-cli-3.2.0.1227-linux.zip && mv sonar-scanner-3.2.0.1227-linux sonar-scanner

  script:
    # Execute Go Meta Linter
    - $GOPATH/bin/gometalinter.v2 samples/ > gometalinter-report.out || true
    # Execute tests and coverage
    - go test -json > report.json
    - go test -coverprofile=coverage.out
    # And then execute SonarCloud analysis which will run its own code analysis, and also reuse the linters' results
    - sonar-scanner/bin/sonar-scanner -Dsonar.projectKey=$SONAR_PROJECT -Dsonar.host.url=$SONAR_URL -Dsonar.login=$SONAR_LOGIN

  cache:
    directories:
    - '$HOME/.sonar/cache'
Your travis.yml file should look like this:
-
Commit your changes on master. This automatically starts a new build in Travis.
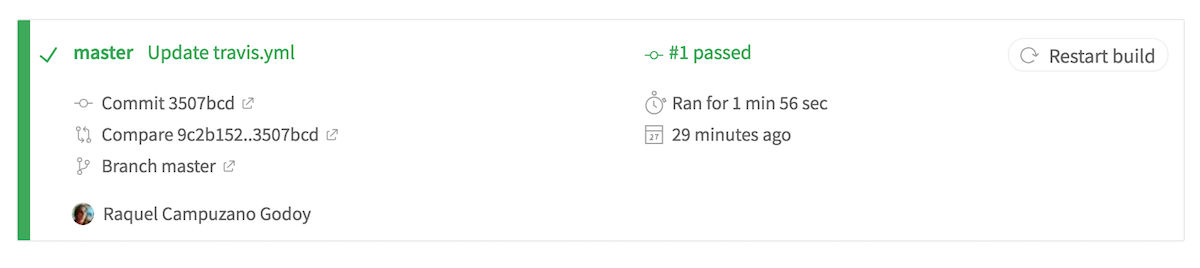
-
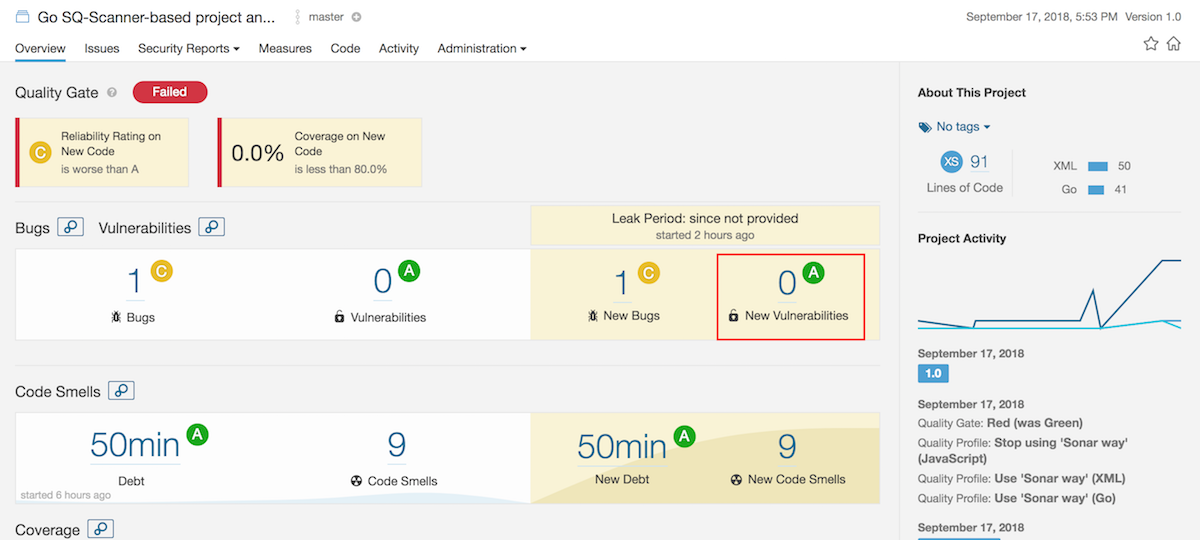
Navigate to the SonarQube UI, you will see that it is running an automatic analysis.
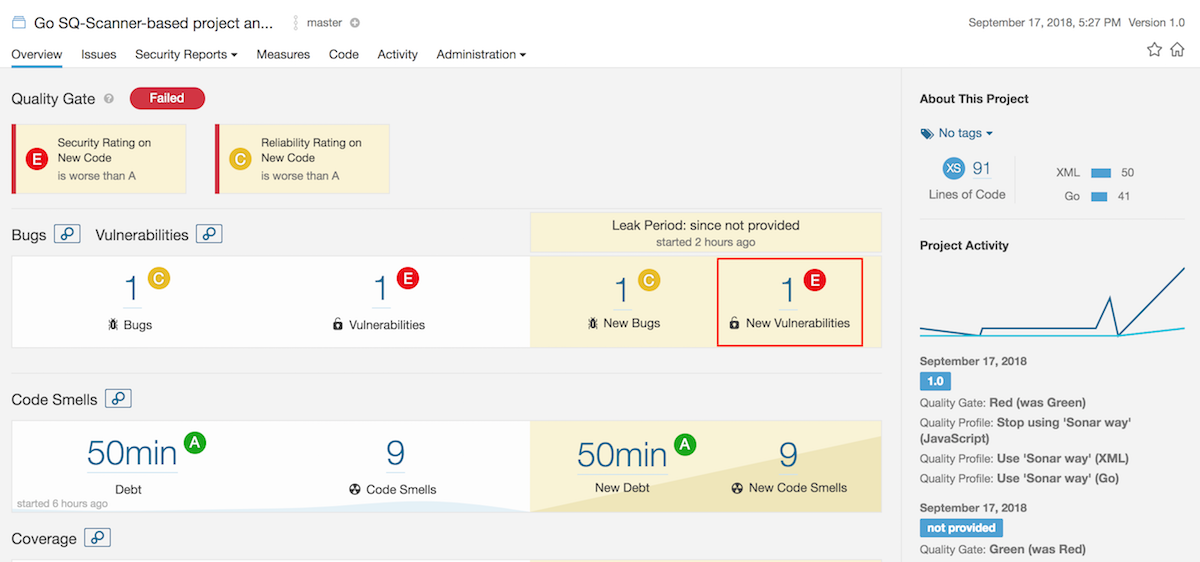
As seen in the screenshot above, there is a bug, a vulnerability, and some code smells in the project. Let’s focus on the vulnerability to see how GitHub, Travis, and SonarQube synchronize their jobs.
-
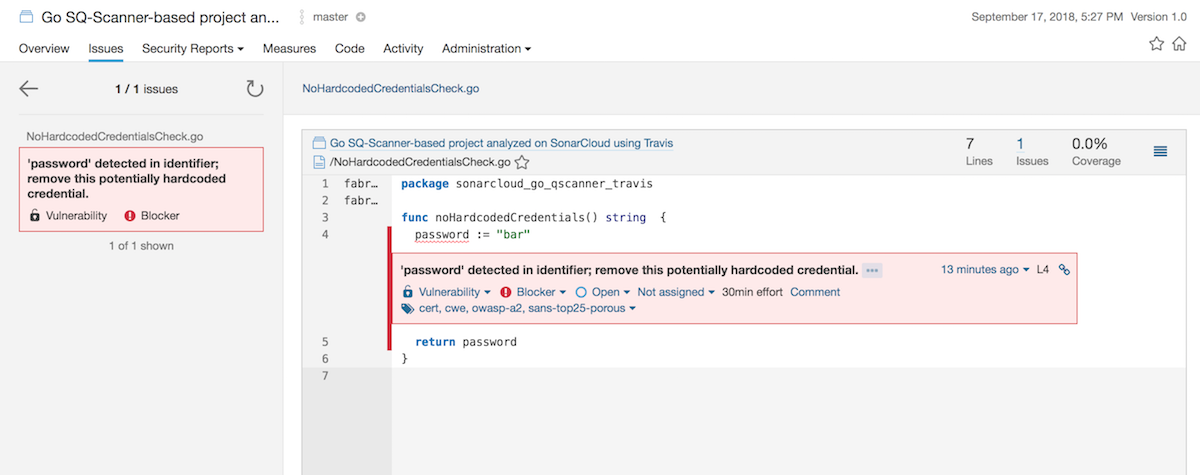
Click on the vulnerability to see which file is affected. The issue is related to the NoHardcodedCredentialsCheck.go file. The password is hardcorded which directly affects security.
-
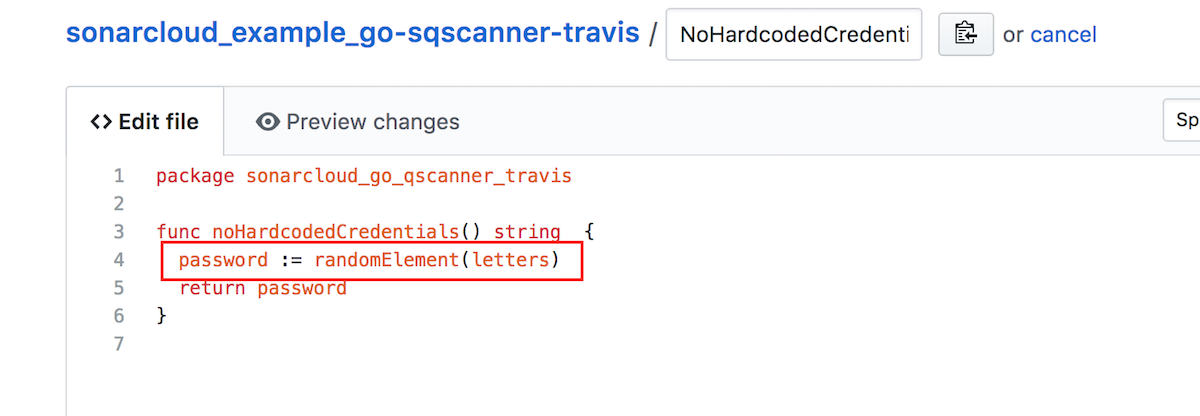
In the sample GitHub repository, replace the current value of the NoHardcodedCredentialsCheck.go file with a random element as shown below:
-
Commit your changes in the master branch to push them. This will begin a new build in Travis and at the same time, a new code analysis in SonarQube.
-
Return to the SonarQube project dashboard. Although the test failed again, you can see that the prior vulnerability has been fixed.
Now, your code is safer and cleaner. You can still use the Travis example repository to continue. Try SonarQube with Travis, or test your recently acquired knowledge using your own code. Check the “Useful links” section for more information on how to squeeze your SonarQube installation.