Monitor Bitnami Stacks with NGINX Amplify
Introduction
NGINX Amplify makes it possible to obtain system and NGINX metrics using a visual dashboard. This is useful to monitor the performance of your applications running on NGINX, as well as to monitor the overall health and status of your NGINX server.
This guide walks you through the process of using NGINX Amplify with a Bitnami stack running the NGINX server. It guides you through the process of installing the Amplify Agent on your NGINX server and updating the Bitnami stack configuration so that the Amplify Agent can begin monitoring server status and health.
Assumptions and prerequisites
This guide makes the following assumptions:
- You have a basic understanding of NGINX and NGINX Amplify.
- You have a Bitnami stack installed with an NGINX server - for example, the Bitnami NGINX Stack.
- You have an NGINX Amplify account. If you don’t, sign up for a free account.
Step 1: Install the Amplify Agent
NGINX Amplify works by installing an Amplify Agent on your NGINX host, which in turn sends metrics to the NGINX Amplify dashboard. However, to install the Amplify Agent, you must first obtain an API key from the NGINX Amplify dashboard. Follow these steps:
-
Log in to the NGINX Amplify dashboard.
-
Review the Amplify Agent installation instructions and make a note of the API key, as shown below:

-
Log in to the server console. Learn how to connect to the server through SSH.
-
Install the Amplify Agent on the server by executing the instructions below at the server console. Replace the YOUR-API-KEY placeholder with the API key obtained from the Amplify dashboard.
  $ wget https://github.com/nginxinc/nginx-amplify-agent/raw/master/packages/install.sh
  $ sudo API_KEY='YOUR-API-KEY' sh ./install.sh
Step 2: Configure the Amplify Agent
The next step is to connect the Amplify Agent with the NGINX server running in the stack. Follow these steps:
-
Log in to the server console. Learn how to connect to the server through SSH.
-
Edit the /opt/bitnami/nginx/conf/bitnami/bitnami.conf file and add the following server configuration block to the end of the file:
server { listen 127.0.0.1:80; server_name 127.0.0.1; location /nginx_status { stub_status on; allow 127.0.0.1; deny all; } } -
Edit the /etc/amplify-agent/agent.conf file and update the nginx section to reflect the NGINX configuration file location and status URL in the Bitnami Stack, as shown below:
  [nginx]
  configfile = /opt/bitnami/nginx/conf/nginx.conf
  stub_status = http://127.0.0.1/nginx_status
TIP: If you’re using a recent version of the Amplify Agent, this step is optional as the information will be automatically detected by the agent.
-
Edit the /etc/init.d/amplify-agent startup script and modify it to load the Bitnami environment variables, by adding the line below under the PATH variable definition:
. /opt/bitnami/scripts/setenv.sh -
If your Bitnami stack includes PHP-FPM, you can optionally configure the Amplify Agent to collect PHP-FPM metrics. To do this, edit the /opt/bitnami/php/etc/php-fpm.conf file and uncomment the pm.status_path variable so that it looks like this:
pm.status_path = /status -
Restart NGINX, PHP-FPM (if configured as above) and the Amplify Agent:
  $ sudo /opt/bitnami/ctlscript.sh restart nginx
  $ sudo /opt/bitnami/ctlscript.sh restart php-fpm
  $ sudo service amplify-agent restart
Step 3: Verify the integration
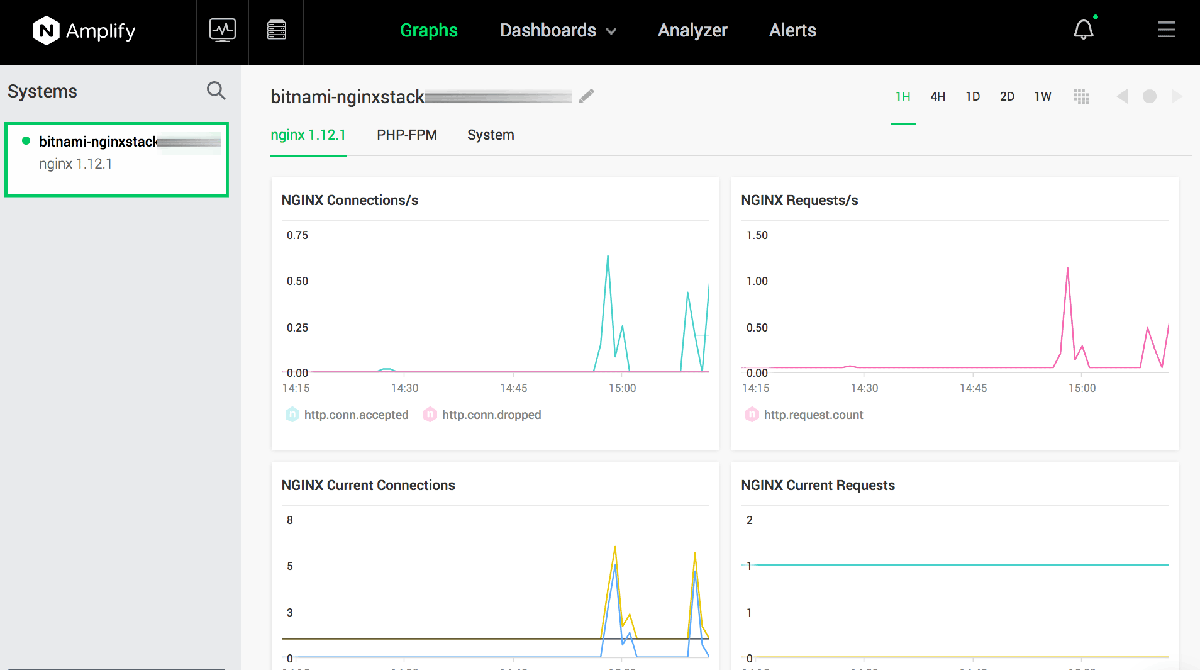
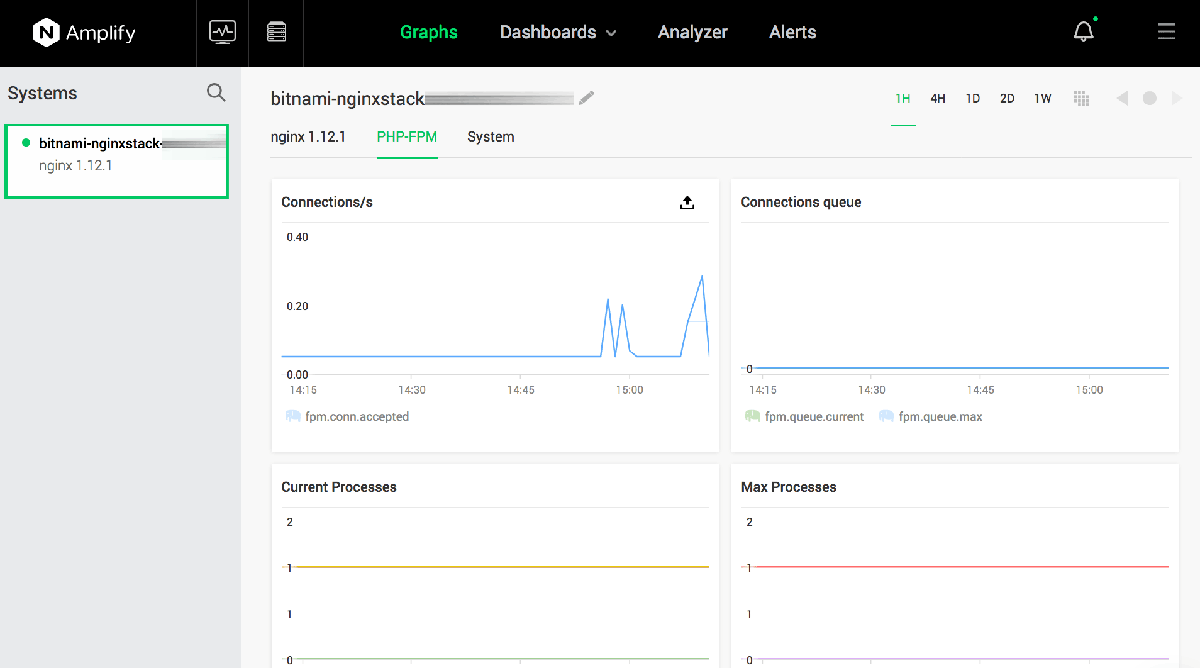
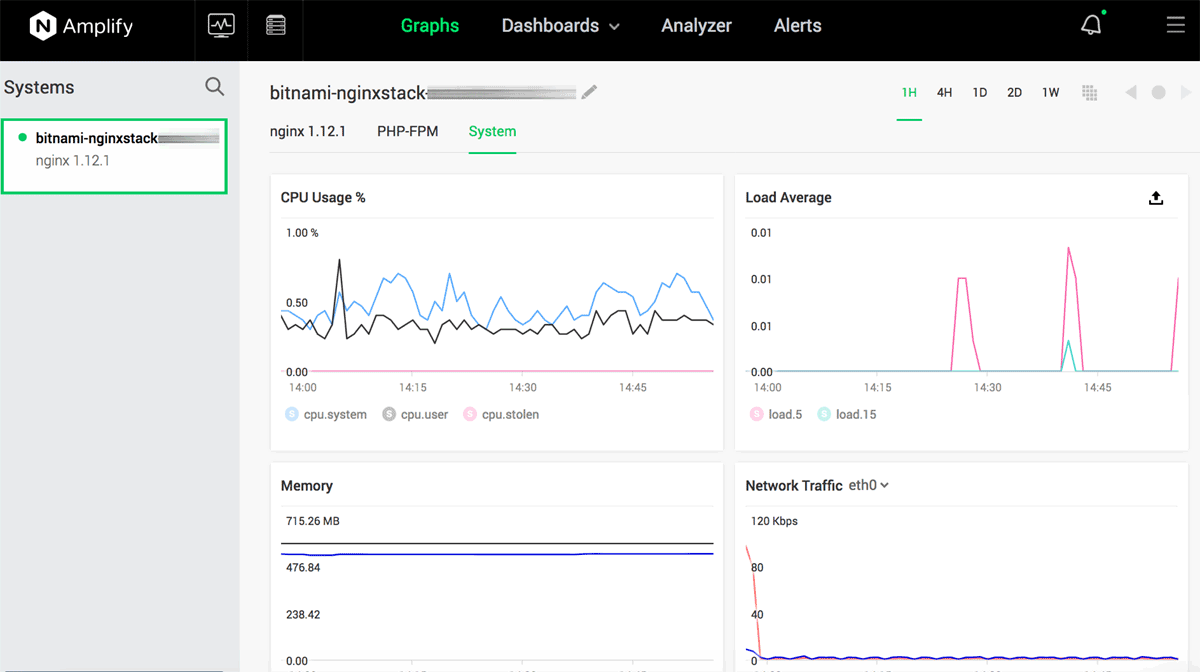
The Amplify Agent should now begin sending data to the NGINX Amplify dashboard. To verify this, log in to the NGINX Amplify dashboard. You should now see metrics and data from your Bitnami NGINX Stack server, as shown below:
Useful links
To learn more about the topics discussed in this guide, use the links below: