Get started
To get started with Bitnami ELK Stack, we suggest the following example to read the Apache access_log and check the requests per minute to the ELK server:
Step 1: Configure Logstash
-
Stop the Logstash service:
$ sudo /opt/bitnami/ctlscript.sh stop logstash -
Create the file /opt/bitnami/logstash/pipeline/access-log.conf as below:
input { file { path => "/opt/bitnami/apache/logs/access_log" start_position => beginning } } filter { grok { match => { "message" => "COMBINEDAPACHELOG %{COMMONAPACHELOG} %{QS:referrer} %{QS:agent}" } } date { match => [ "timestamp" , "dd/MMM/yyyy:HH:mm:ss Z" ] } } output { elasticsearch { hosts => [ "127.0.0.1:9200" ] } } -
Check the configuration is OK. You should see an output message like below:
$ /opt/bitnami/logstash/bin/logstash -f /opt/bitnami/logstash/pipeline/ --config.test_and_exit Configuration OK -
Start the Logstash service:
$ sudo /opt/bitnami/ctlscript.sh start logstash
Step 2: Check Elasticsearch
-
Access your server via browser to http://SERVER-IP/ to generate an Apache log entry, so it is read by Logstash and sent to Elasticsearch.
-
Check Elasticsearch is receiving data. You should see an index called logstash-DATE:
  $ curl 'localhost:9200/_cat/indices?v'

  health status index               pri rep docs.count docs.deleted store.size pri.store.size
  green  open   .kibana               1   0          1            0      3.1kb          3.1kb
  yellow open   logstash-2017.02.21   5   1          1            2     11.2kb         11.2kb
If you are unable to see the configured logs with the previous command, try stopping and restarting the Logstash service using the following command instead:
$ sudo /opt/bitnami/ctlscript.sh stop logstash
$ /opt/bitnami/logstash/bin/logstash -f /opt/bitnami/logstash/pipeline/access-log.conf
Step 3: Configure Kibana pattern
-
Access the Kibana app via browser (http://SERVER-IP/app/kibana), and use your user/password to pass the basic HTTP authentication.
-
Specify a timestamp by entering this value to the “Available Fields -> @timestamp” field.
-
Click the “Create” green button.
-
On the left bar, click the “Discover” menu item. You should see something like the screenshot below:
Step 4: Create a Kibana dashboard
-
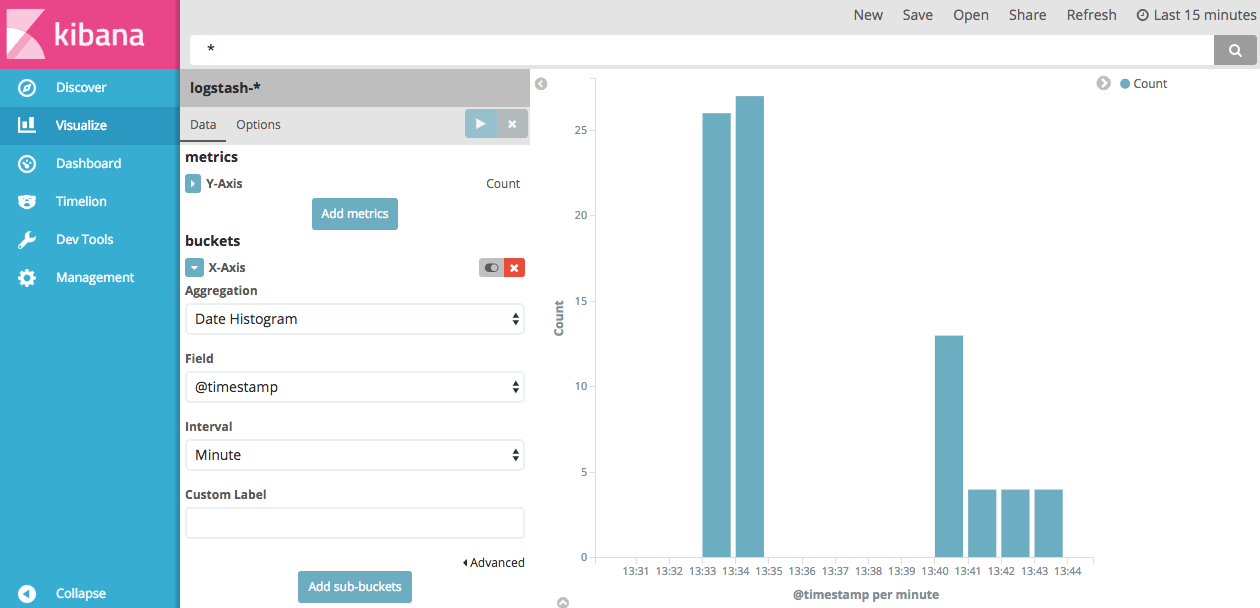
On the left bar, click “Visualize” menu item.
-
Select the “Vertical bar chart -> From a new search” menu options.
-
Select “logstash-*” index.
-
Click the “X-Axis -> Aggregation -> Date Histogram” button sequence.
-
Select “Minute” in the “Interval” field, and click “Apply changes” button.
-
Save the visualization.
-
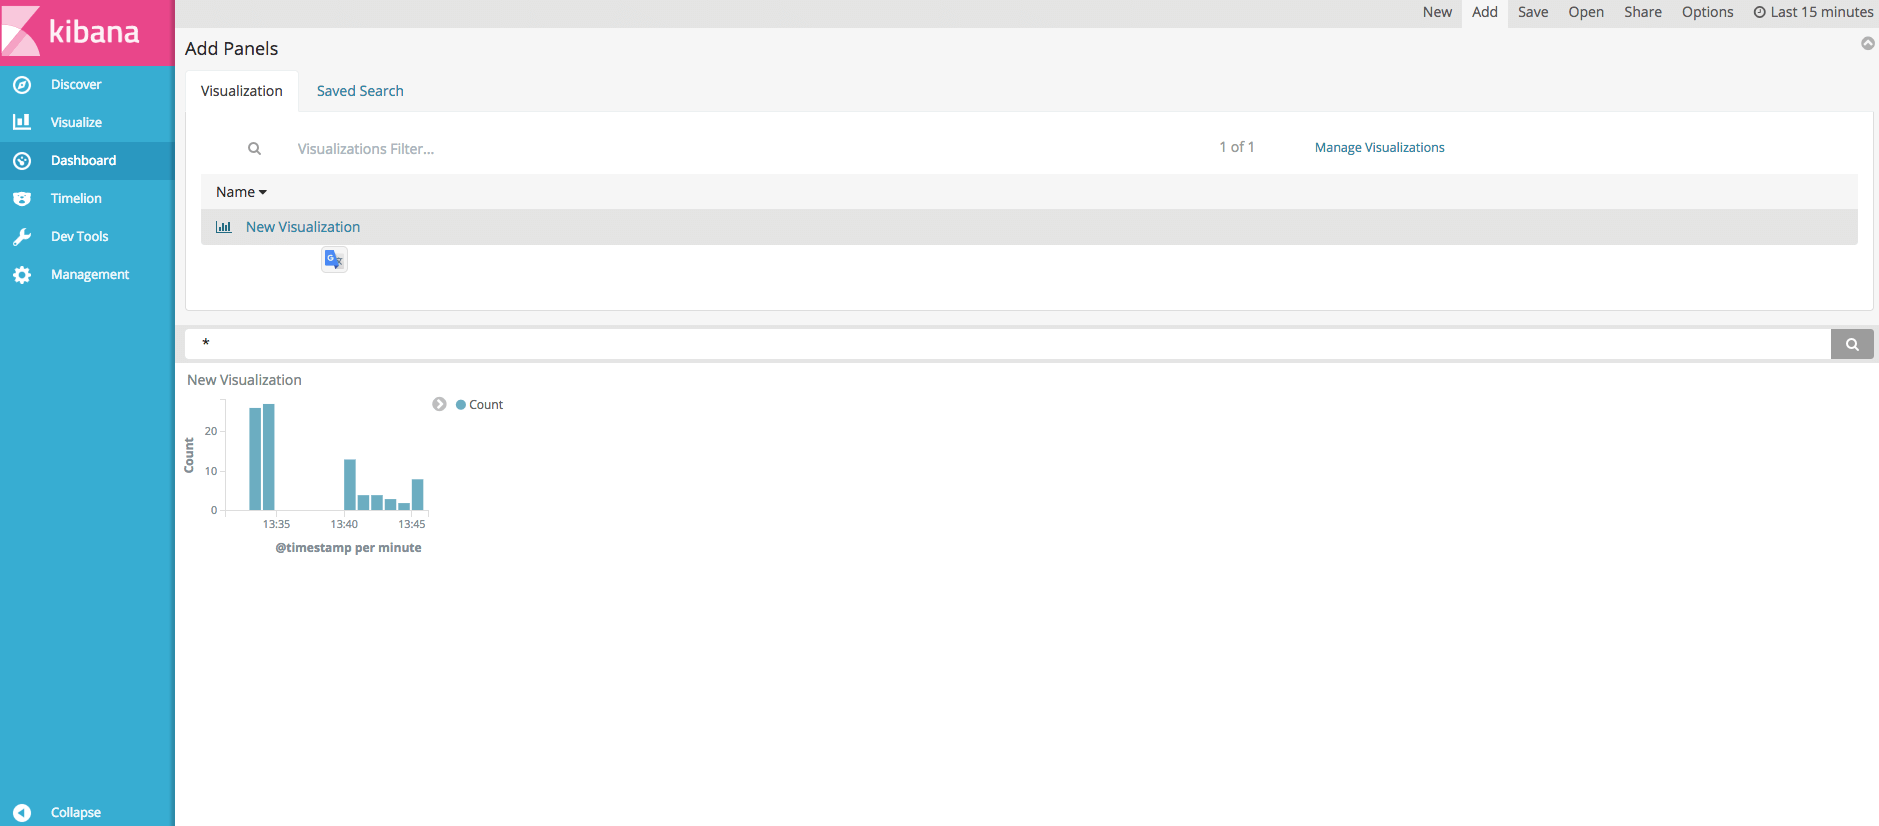
On the left bar, click “Dashboard” menu item.
-
Click the “Add” button, select the previous visualization and save the dashboard.


