Get started with Grafana
To get started, we suggest the following steps:
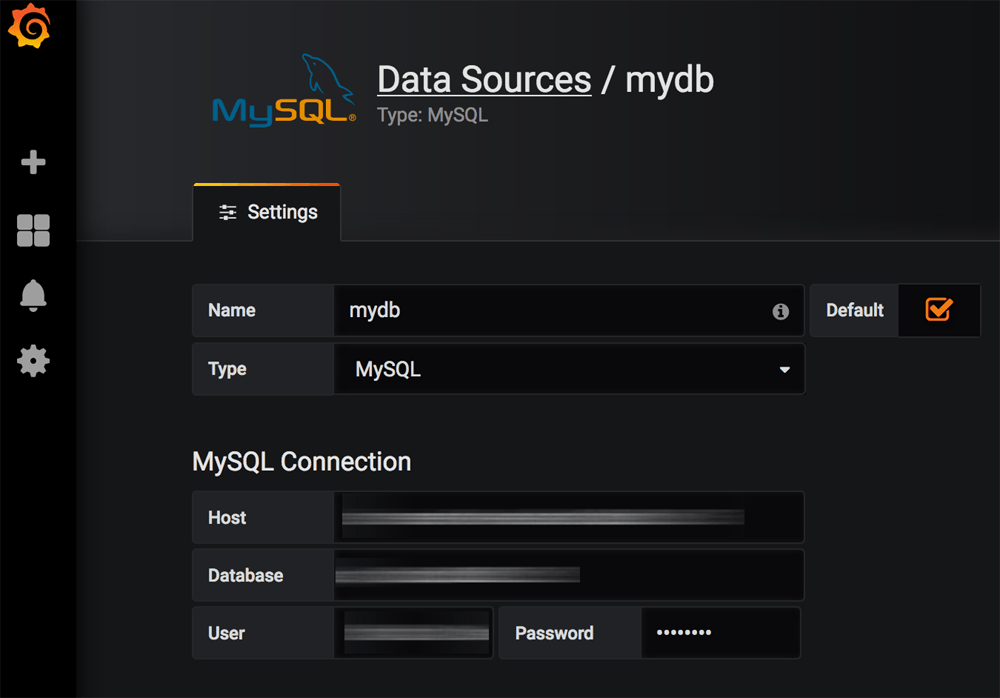
Step 1: Add one or more data sources
Log in to Grafana and create a new data source using the “Configuration -> Data Sources” menu item. Available options include Elasticsearch, MySQL, PostgreSQL, Prometheus and Graphite.
For more information, refer to the official documentation.
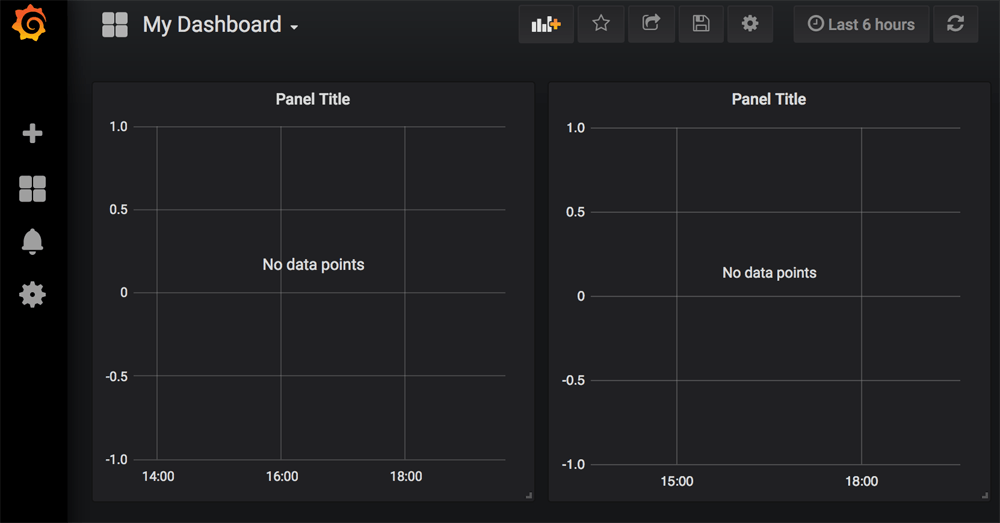
Step 2: Create a dashboard and panels
Add a new dashboard using the “Create -> Dashboard” menu item. Then, add panels to it depending on your query needs.
You can also configure your dashboards in Grafana by adding one or more YAML-formatted configuration files in the /opt/bitnami/grafana/conf/provisioning/dashboards directory. For more information, refer to these instructions.
Step 3: Run queries
Once Grafana has started collecting metrics, run queries using the query editor. Learn more about the query editor.


